MARYANDRES
Co.Lab
Improving health outcomes with mobile tracking and monitoring
Over 60% of the American population suffers from a chronic health condition, with over 40% experiencing recurring or multiple ailments. Having an easy and reliable way to manage symptoms and health information, could help people understand how their daily symptoms and activities affect their overall well-being.
ROLE
UX Designer
UI Designer
DURATION
8 Weeks
2 Four-week sprints
TEAM
Product Manager
Front-End Developer
Back-End Developer
DELIVERABLES
User Interviews
Competitive Analysis
Mock Ups
Prototypes
Usability Tests

Healthscribe
Reimaging healthy lifestyles
For this opportunity, our team worked with Co.Lab to create a solution that would encourage users to take ownership of their health and wellness by following a consistent self-management routine.
Healthscribe's mission is to empower users to improve their overall health by identifying patterns and isolate potential causes for various health issues. This would improve their self-awareness and increase their ability to share accurate and timely information with doctors.
Efficient Timeline
New interfaces can be intimidating so I built the experience around a card-based timeline. Timelines and cards are easy to understand and will make the app easier to learn. Users can manage their lifestyle choices and events in one place and scan large amounts of information to find what they need quicky.

Increased Productivity
Users are easily frustrated by recording methods that are too complicated or time consuming. Simple forms with smart defaults minimize errors and reduce the need for information to be entered manually and redundantly.

Useful Insights
Data visualization places the user’s information in context, making it easier to understand. Users will easily see how their life choices and symptom triggers impact their overall health. They can also set achievable goals and view their progress over time.

Building from the ground up
Launching a fully functional MVP
Our team chose to focus on building a minimal viable product (MVP) that gives customers the ability to see how their lifestyle choices and events impact their overall health and wellness so that it can inform their decision-making.
Project Goals
Goal #1: Encourage users to create a habit of tracking their symptoms.
Goal #2: Reduce the number of steps required for users to enter information.
Goal #3: Present users with a history of data that is easy to understand.
Involving developers early
Learning about our users
I interviewed four people to find out what symptoms and triggers are cause for concern, how often they track that information and why, and tools they use to record it.
Capturing their responses in Miro made it easy to share findings with my team.

This initiated a conversation with the developers about functionality and the technical components that would be needed to help customers achieve their goals.
We decided the app needed to be flexible enough to meet various needs but only required one entry point and interface to accomplish it.
Activities & Outputs
4 User Interviews
Affinity Mapping
Miro Discovery Doc
Transforming insights into action
Defining product features
Insight 1
75% of participants rely solely on memory or physical notes to record information. These methods are burdensome and could lead to memory problems...
Result: The app provides a way for users to view information for specific days and long periods of time, so they can see trends and patterns in their habits.
"My doctor asked about my symptoms,
but I couldn't remember everything.
I worry sometimes that I didn't share something important."
— Research Participant
Insight 2
All participants indicated that they do track their symptoms and often. Tracking can be as simple as writing information on a random piece of paper or as complex as using a digital app.
Result: The app provides a simplified interface that reduces the amount of steps needed to enter and view information. This provides users with immediate data and insights.
"I would use a digital tool . . . only if it doesn't take a long time to figure out?
I don't like typing the same information over and over."
— Research Participant
Insight 3
50% of participants, misplace, lose track, or forget information when visiting the doctor. This limits their ability to pinpoint habits that intensify or worsen specific symptoms and conditions.
Result: The app uses data visualization to help users interpret data collected over time to assist with their decision-making.
"I get frustrated when I can't remember where I left my written notes."
— Research Participant
Activities & Outputs
4 User Interviews
Affinity Mapping
Miro Discovery Doc
Designing with empathy
Understanding our users needs
Based on the findings from the user interviews, I identified five types of users and situations where our product could be used.

Dan
Diagnosed with a diabetes.
Noah
Struggles to make healthier
choice in diet and daily routine

Jordan
Proactive about maintaining
a healthy lifestyle

Bridgette
Experiences recurring back pain

Emma
Experiences stomach aches caused by stress and anxiety
I decided to focus on Dan's persona because having a chronic condition can be debilitating and take effort and a willingness to make lifestyle changes. Dan's persona helped me to take a minimalistic approach to building a helpful and supportive product that minimizes any additional burdens.
Activities & Outputs
User Personas
Journey Mapping
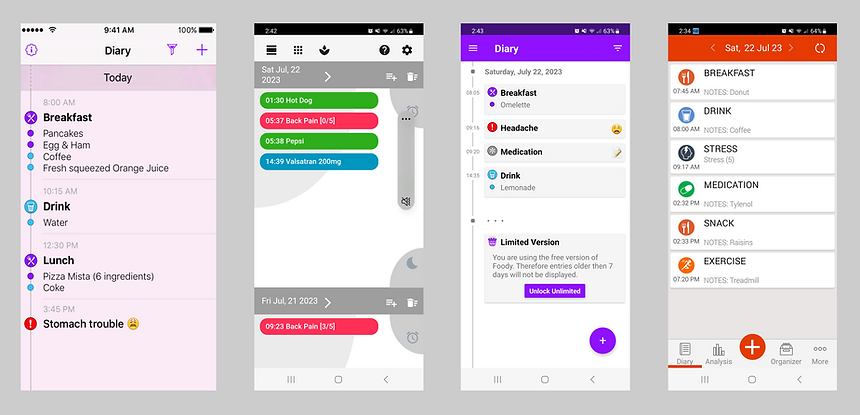
Looking for inspiration
Identifying opportunities to start strong
Before designing the wireframes, I examined the user flows in various symptom and wellness tracking apps and found that most:
-
focused on providing information in an easy to access interface
-
showed real-time data in a timeline format making it easy to scan
-
used simple visuals to represent data and show connections between information
Activities & Outputs
Competitive Analysis
Miro Analysis Doc
Conceptualizing the experience
Putting the pieces together
I started by making sketches, and then transformed them into wireframes in Figma. Once my team members reviewed and gave feedback on my ideas, I created the final designs.
.png)
Paper Sketches
Wireframes
Instilling confidence and trust
Hearing from users
I created a high-fidelity prototype and conducted 3 user testing sessions to gauge the effectiveness of the design.
Change 1
Empty States
Usability results revealed that 75% of testers expected more guidance entering the app. An empty state was used to signal the beginning of the user's journey.
.png)
Change 2
Confirmations
Confirmation messages were added to provide users with the results of their actions and to make the flow more obvious.
%20(1)%20(1).png)
Activities & Outputs
3 Usability Testing Sessions
Hi-Fi Prototype
Building the solution
Making a usable product
Our team set out to deliver an experience that would make it easier for people to manage their conditions with greater ease and confidence. I decided that the best option for delivery was a web application because it has a shorter development time than a native app, does not need to be installed, and can be accessed by users through multiple browsers and various apps.
I addressed the challenge of working in different time zones by creating a design system using Notion and Figma. This made it easier to share design assets with the developers and to follow up with them regarding updates.

Activities & Outputs
Design System
Achieving the best outcomes
Measuring Results
I was able to deliver the final designs to the developers two weeks ahead of schedule. I decided that there were four key metrics that I could measure to see if our solution effectively addresses the problem.
.png)
Acquisition
Number of users signing up per week

Retention
Percentage of users signing into the app over time
.png)
Task Success
Percentage of users adding new events successfully
%20(1).png)
Engagement
Percentage of time spent adding/viewing events
and analyzing data
Learning about stakeholders
Lessons Learned
Since we were building a new product from the ground up, a lot of time was spent in discovery and considering technical constraints. This slowed down our progress. So I created a communication system to keep the project on track and to encourage timely communication and knowledge sharing.
Our team benefited greatly and took a proactive approach to resolving challenges. This reinforced for me how critical effective communication is for involving all stakeholders in the beginning and taking the time to understand their perspective and experiences.
.png)
.png)